Monitoring dashboards and alerts have distinct roles in monitoring. Problems arise when people fail to form a contradistinction between them. Both are communication tools, but communicate differently. Monitoring dashboards communicate the current status of system’s and their attributes, whereas alerts communicate abnormal status that requires human intervention. Currently at Stack Overflow, we use Grafana and Opserver as dashboards and Bosun for alerting. Bosun has a dashboard that shows the current alerts, but when I refer to dashboards I mean things like Grafana and Opserver.
Mistake 1: Using Alerts as Status Dashboards
When alerts are used as if they were status dashboards, it leads to alert desensitization or Alarm Fatigue. If you have alerts that come in that are just informational – it is human nature to start to ignore them due to Sensory Gating (and anecdotally, it is not uncommon for people to literally filter them with something like Gmail when alerts are in email). Even if discipline is good, people sometimes won’t even see them anymore since our brains naturally filter out repeated information.
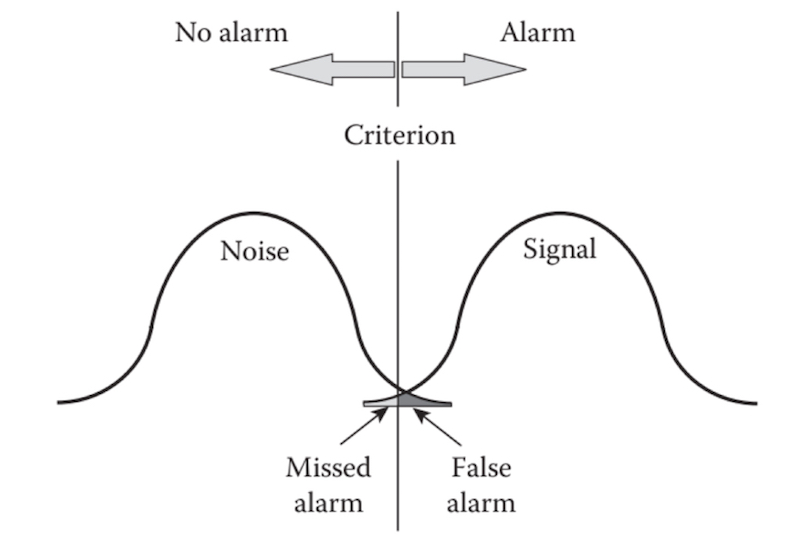
The underlying philosophy is that too many alerts are just as bad some “missed alerts”. This is expressed well in Owning Attention: Considerations for Alert Design:
Example within this Philosophy
As an example, take a 30 node cluster where it is common for a couple of nodes to be down at a time. The number of nodes that are out, and which nodes they are out should be in a dashboard. However, that shouldn’t generate alerts because it is normal behavior. Rather, you should have a dashboard that shows all this information, and only alert where the behavior deviates from its normal pattern and requires human intervention. Ideally the alert notification has most of the contextual information you would see in the status dashboard, but in practice web dashboards provide more capability than most notification mediums like email can. Alerting strategies in this case include the following:
- Cluster vs host based alerts: Notifications can be sent per cluster or per node in the cluster (I call this “scope”). Both scopes are valid, if your nodes tend to fail in groups, it is generally better for a broader scope (cluster based) so there are less notifications that can lead to alarm fatigue.
- Maintenance aware alerts: If nodes normally only go out during maintenance, alerts should only trigger when nodes are not in maintenance (and maybe if too many nodes are in maintenance). Maintenance can be identified by tracking maintenance as a metric, or by notifying the monitoring system of maintenance.
- Number or percentage of down nodes: You can alert only if N or more nodes down, a certain percentage of nodes in the cluster are down, and/or the number of down nodes is abnormal compared to history.
- Abnormal host downtime: If nodes normally are only down for certain periods of time, you could alert on the node or cluster if a node has been down for longer than the expected duration.
What combination of the above to use would depend on your specific environment. It is also possible that you do want to alert when a node is down in the cluster at all. The right balance is when you actually react to almost all the alerts. If you are getting alerts that you don’t do anything about, they are informational and are more appropriate for dashboards.
Mistake 2: Relying on Alerting or Dashboards at the Exclusion of the Other
The downfall when depending on dashboards to show you abnormal status is that it requires that someone is looking at, and interpreting the dashboard correctly. If you have the human resources for this it can make sense in certain situations, but as a rule of thumb if you notice something that needed human action on a dashboard and didn’t get an alert for it than an alert needs to be created.
Dashboards are vital to monitoring and one shouldn’t depend on solely on alerts:
- Visualizations provide a lot of condensed information about systems rapidly
- Dashboards help build operator’s mental models of systems. By watching normal behavior and internalizing, operators understand the system better and are more prepared for unexpected emergency situations.
- It is faster to create dashboards that show a lot of information then it is create and tune alerts that are low in noise.
- Humans are very good at picking up anomalies visually, doing this with alerting code is more difficult. Dashboards can help you discover alerts that are missing.
Status dashboards and alerting are essential companions to each other in monitoring, but they need to be used correctly, and when they are treated as one-to-one mappings of each other in purpose you end up limiting both your dashboarding and alerting capabilities.